Brain stress testing using BOLD MRI to evaluate cerebrovascular reactivity (CVR) is of growing interest for evaluating white matter integrity. However, even under healthy conditions, the white matter BOLD-CVR response differs notably from that observed in the gray matter. While we might be quick to attribute these differences to possible pathology, we might also consider that they may also arise from variation in normal venous architecture.
Consider grey matter corticalal arteries are organized centripetally (i.e. towards the center); arteries penetrate from the pial surface towards the center of the brain while branching within the cortex. In some cases, these vessels may also penetrate the sub-cortical white matter. In this superficial brain region, drainage occurs centrifugally (away from the center) as associated veins carry blood back to the pial surface and eventually the superior sagittal sinus via the intra-cortical, subcortical, and superficial medullary veins. In deeper white matter regions, blood is drained centripetally. This pattern is clear when observing the medullary veins that originate 1-2 cm below the cortex and drain via the subependymal veins lateral to the ventricles.
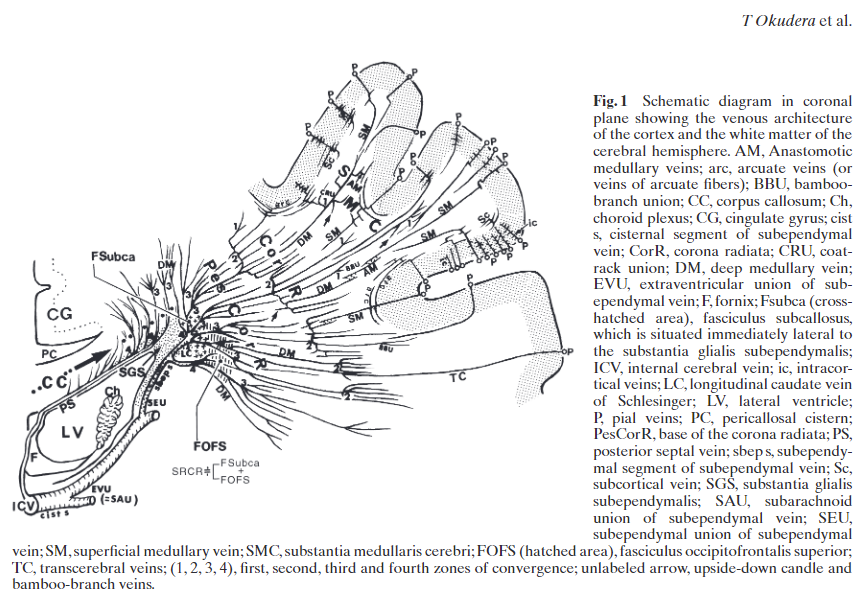
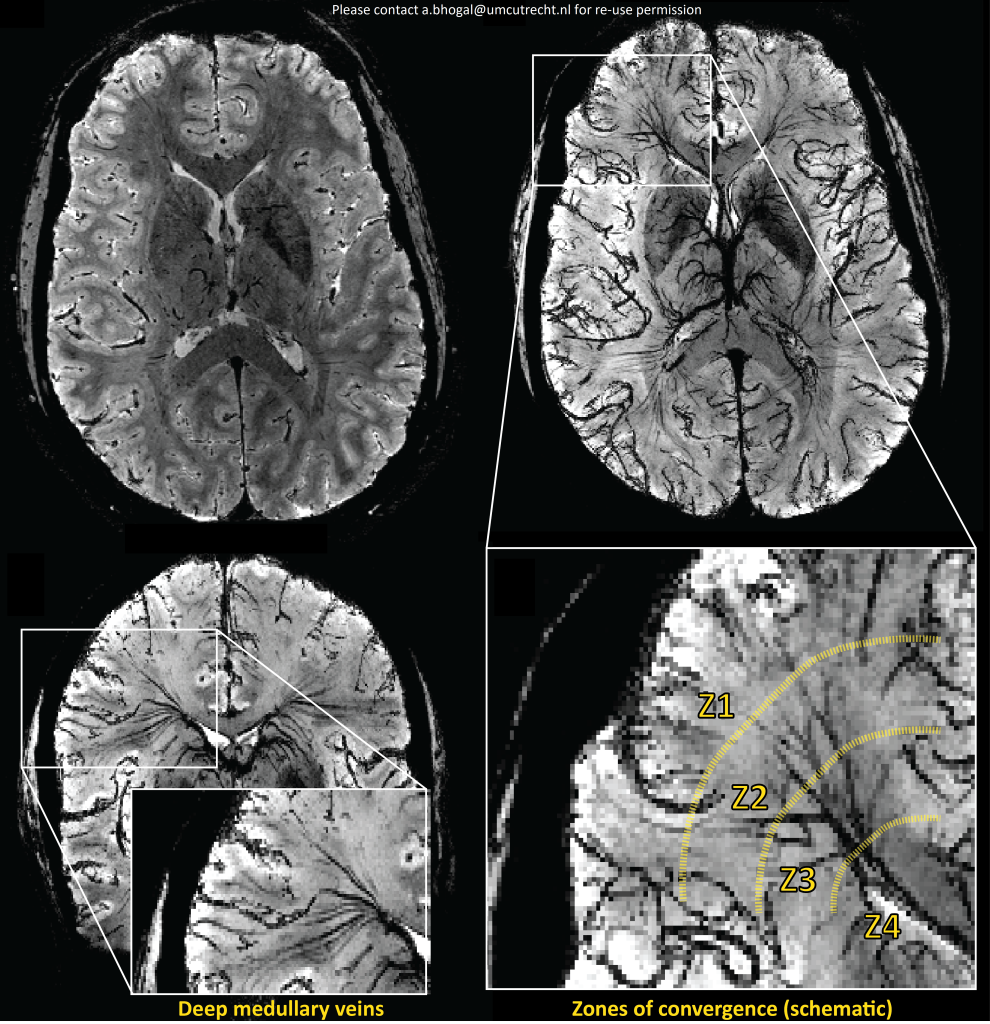
The important thing to note is that in grey matter, feeding arteries (where the CVR response occurs) lie in close proximity to associated draining veins (where we measure the BOLD signal). In white matter this isn’t always the case, and as veins become progressively larger, they collect blood towards sites that may be distal to where the arterial CVR response (i.e. dilation to drive CBF increase) occurs. The white matter draining vein architecture is beautifully explained in the work of Toshio Okudera et al. (Neuropathology, 1999), from which I have borrowed the figure below (left). When comparing with high resolution T2*-weighted images acquired using a 7 Tesla MRI system (below: right), specific features described in the work of Dr. Okudera can be identified – these are known as convergence zones (where blood comes together).
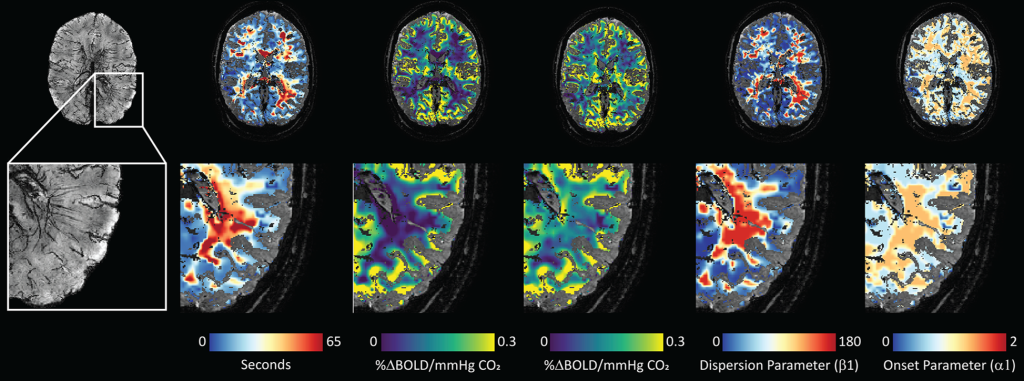
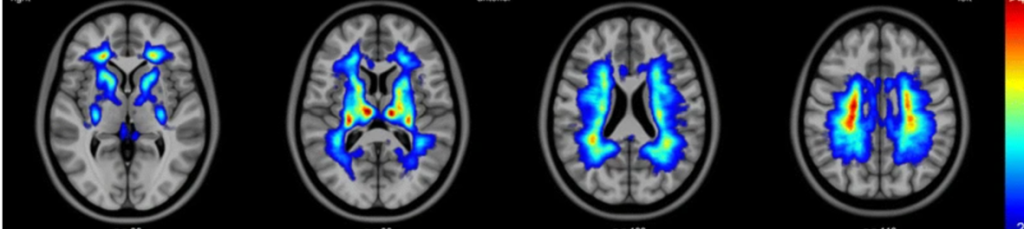
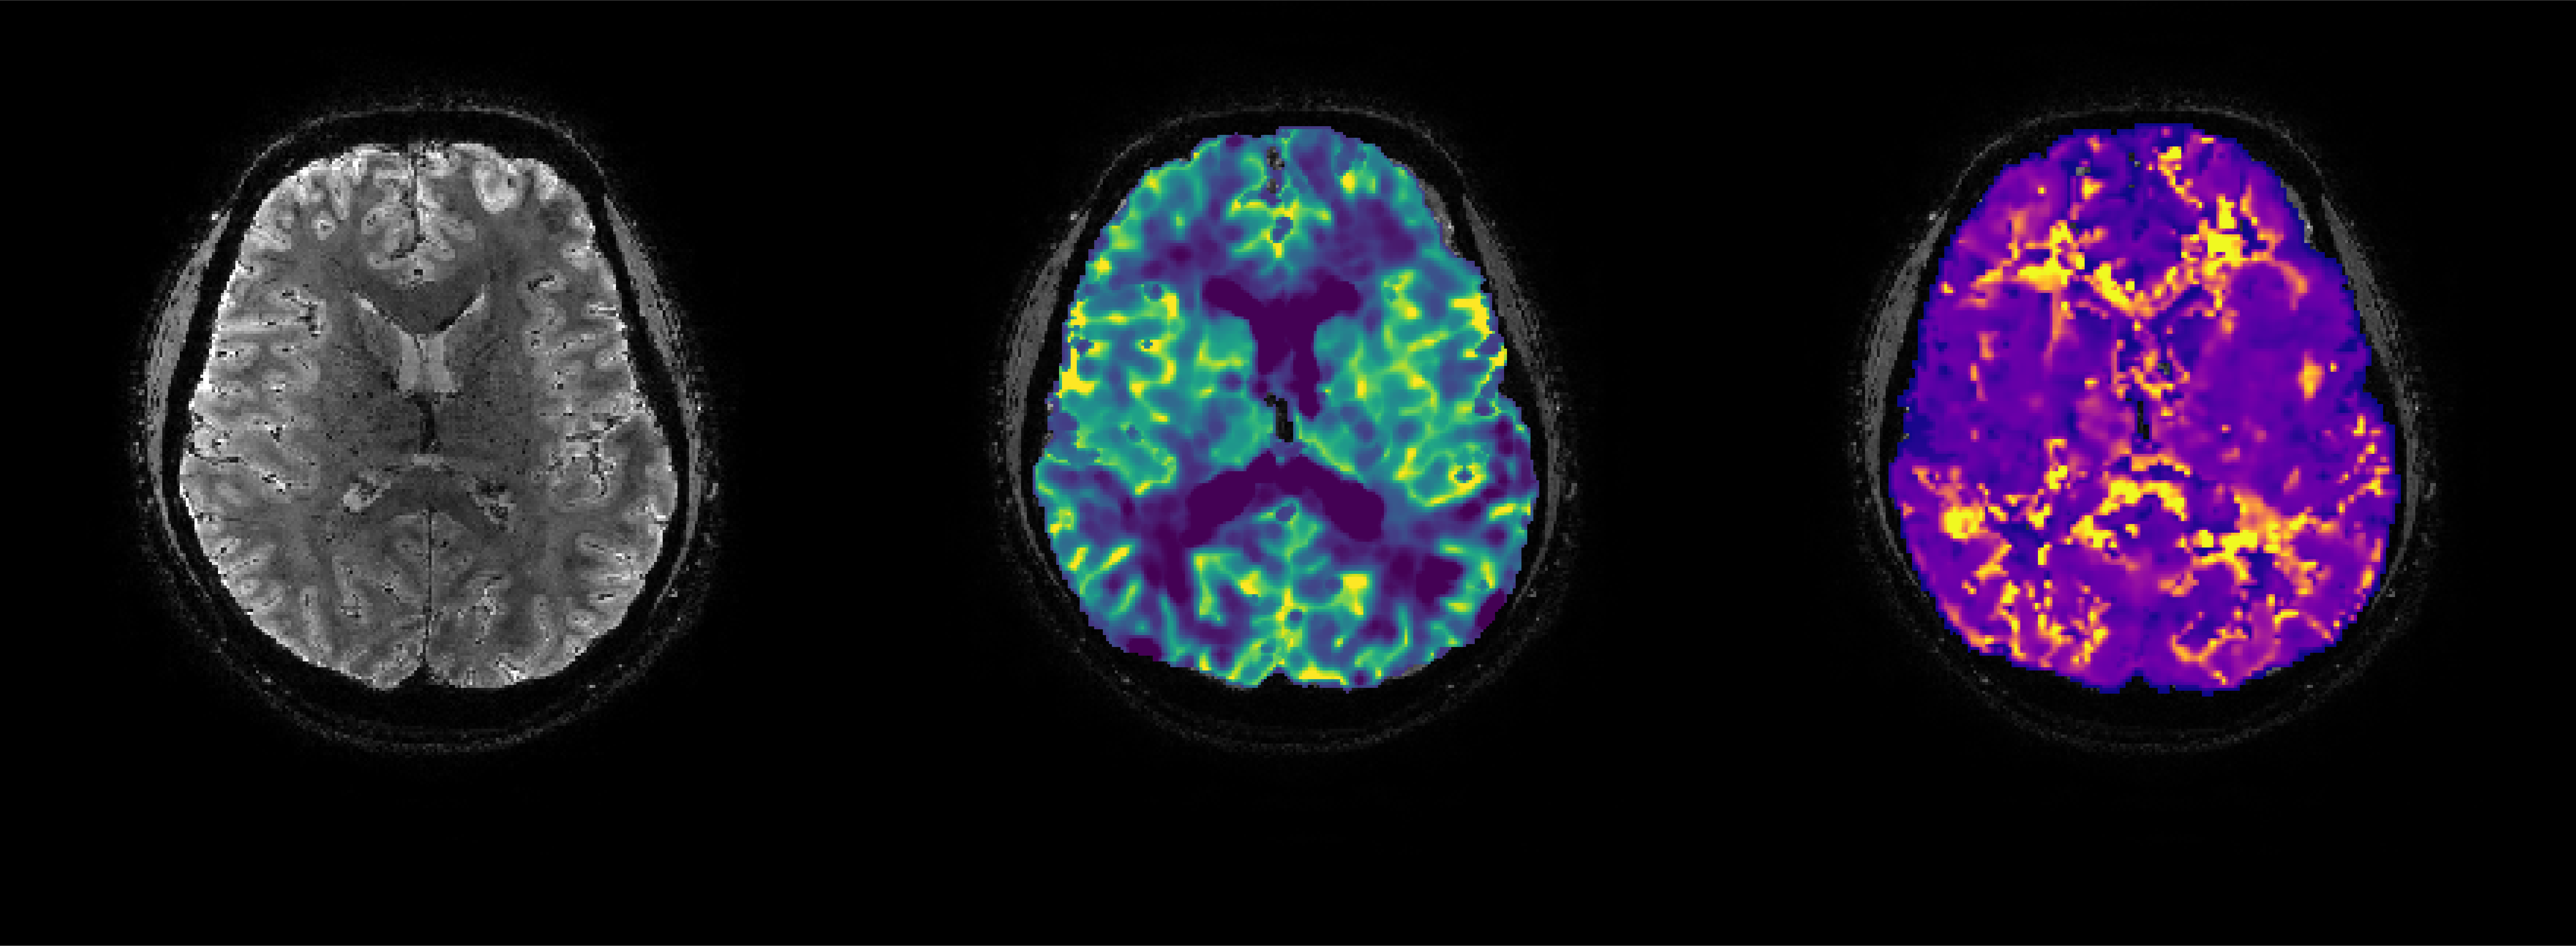
Using the various tools provided in the seeVR toolbox I took a deep dive into this notion and found a relationship between the architecture of the white matter veins and various hemodynamic parameters. The distribution of these parameters (example above) showed a good correlation with the frequency of medullary veins quantified using the medullary vein atlas published by Kuijf et al. (example image below; link to at bottom).