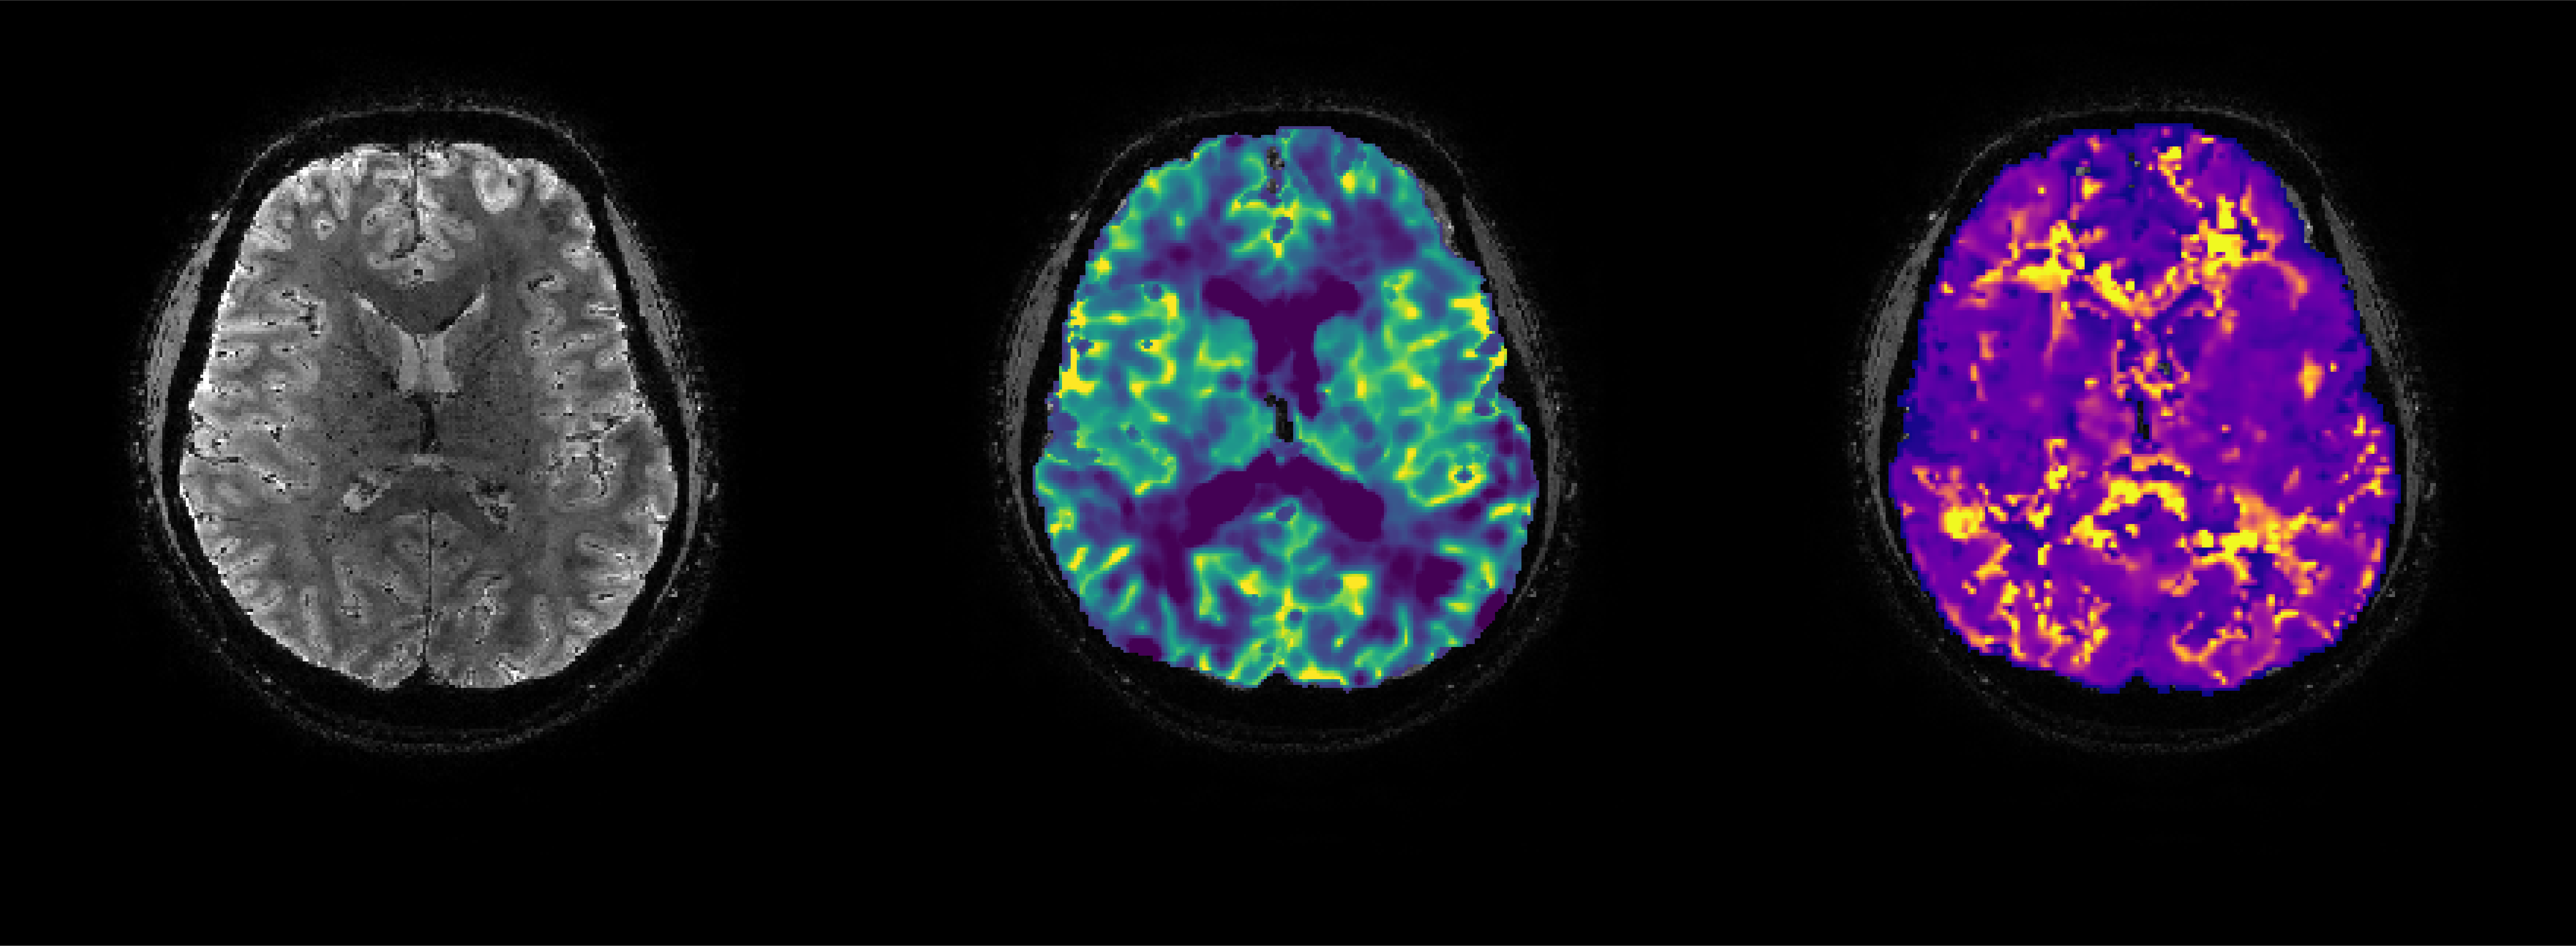
A promise of magnetic resonance imaging (MRI) has been its potential to provide non-invasive biomarkers that are sensitive to physiological changes linked to early stages of disease. This is in contrast to the current clinical standard that relies mainly on tissue structural information to identify disease-induced changes. One of the most exciting techniques gaining widespread adoption involves the mapping of the cerebrovascular reactivity (CVR) response to vasoactive stimuli for insight to the hemodynamic state of tissues. This is typically done by acquiring consecutive Blood Oxygen Level Dependent (BOLD) functional MRI (fMRI) images (usually one image every 1-3 seconds) while delivering a physiological stimulus designed to stress the vasculature (hypercapnia –> dilation –> increased cerebral blood flow –> BOLD response) or modulate hemoglobin saturation (hyperoxia –> increased venous Hb saturation –> BOLD response).
The elevated carbon dioxide required to stress the cerebral vasculature can be delivered in a number of ways including gas delivery systems designed to apply standardized stimuli, high flow gas delivery systems that increased the concentration of fixed inspired CO2 and even simple breath-holding techniques that exploit the body’s endogenous rate of CO2 production and accumulation. By combining knowledge of the applied stimulus with the MRI signal information, parametric maps of vascular reactivity can be created. These maps can identify vascular impairments along with delays in the vascular response that might indicate collateralization of cerebral blood flow or other consequences of pathology. The seeVR toolbox is a series of Matlab functions designed help analyze CVR (and related data). Depending on the type of stimulus used and the properties of your data acquisition, a number of options are available. All code is open-source and freely downloadable from the seeVR github repository (see Docs & Code section). In addition, I have implemented a set of tutorials consisting of complete data analysis pipelines written using Matlab (see Tutorials section). Tips and additional functionality will be periodically added to the blog section of seeVR.nl.

